Distribution Analysis
Distribution analysis shows a real-time snapshot of how leads are distributed across pipeline stages and custom fields.
Default view: stage distribution
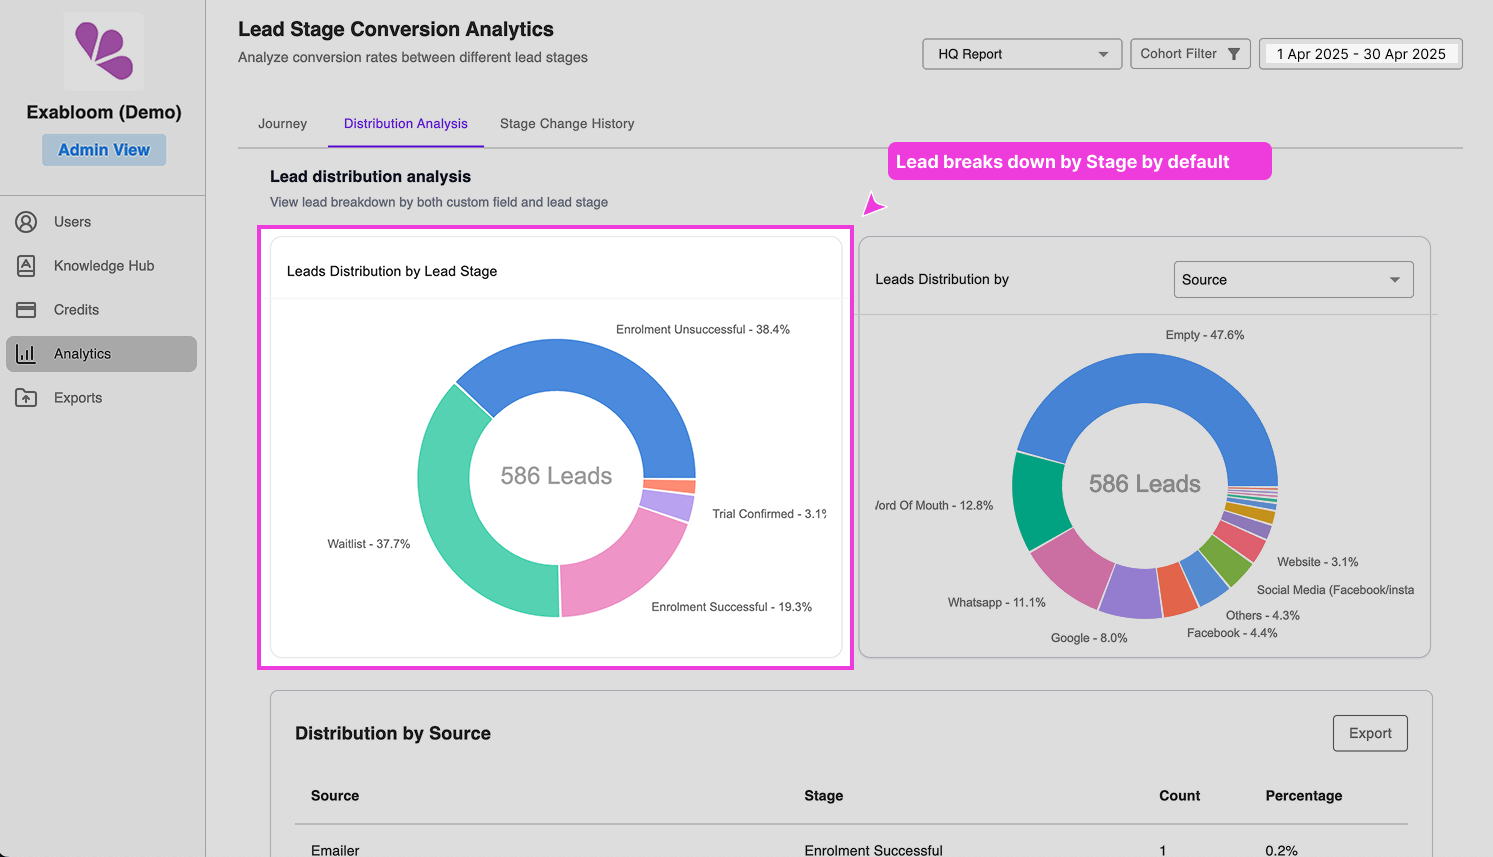
The default view shows leads grouped by current pipeline stage, including:
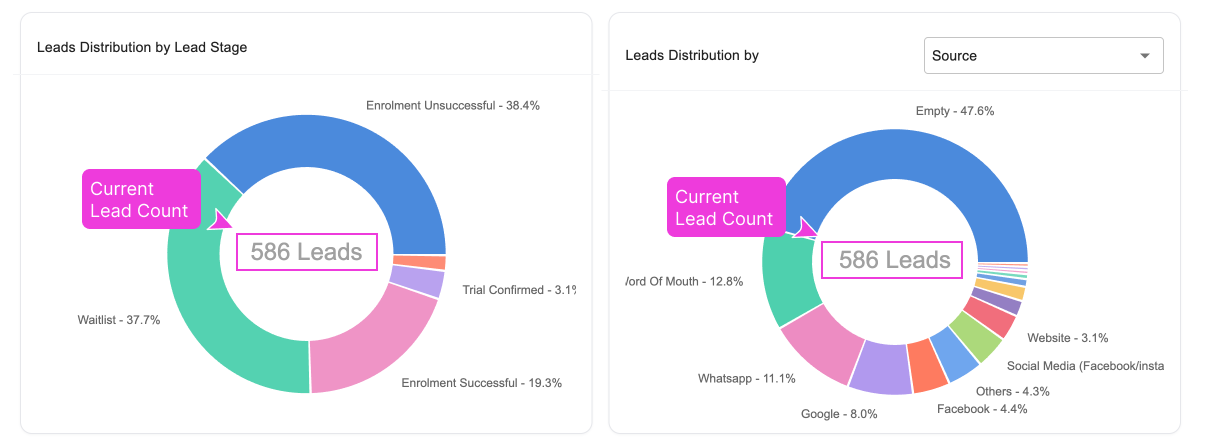
- Total lead count and count per stage
- Percentage breakdown
- Visual chart representation
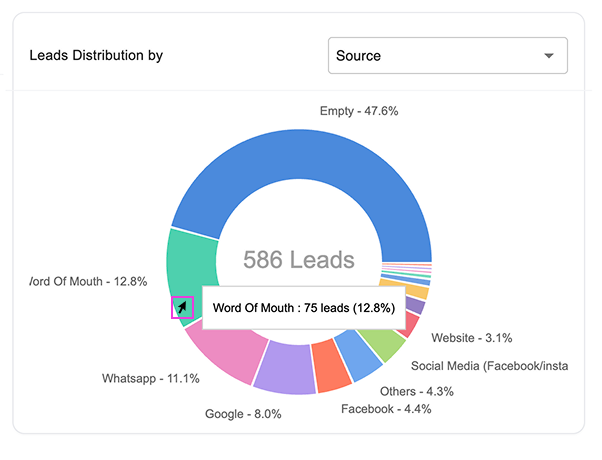
Hover over a section of the chart to see the exact count.
Set up the analysis
- Select your report from the dropdown.
- Set the date range (filters by lead creation date).
- Optionally, apply cohort filters.
Custom field analysis
Select a custom field (e.g., Source, Assigned User) to see how leads are distributed by that field in addition to stage.
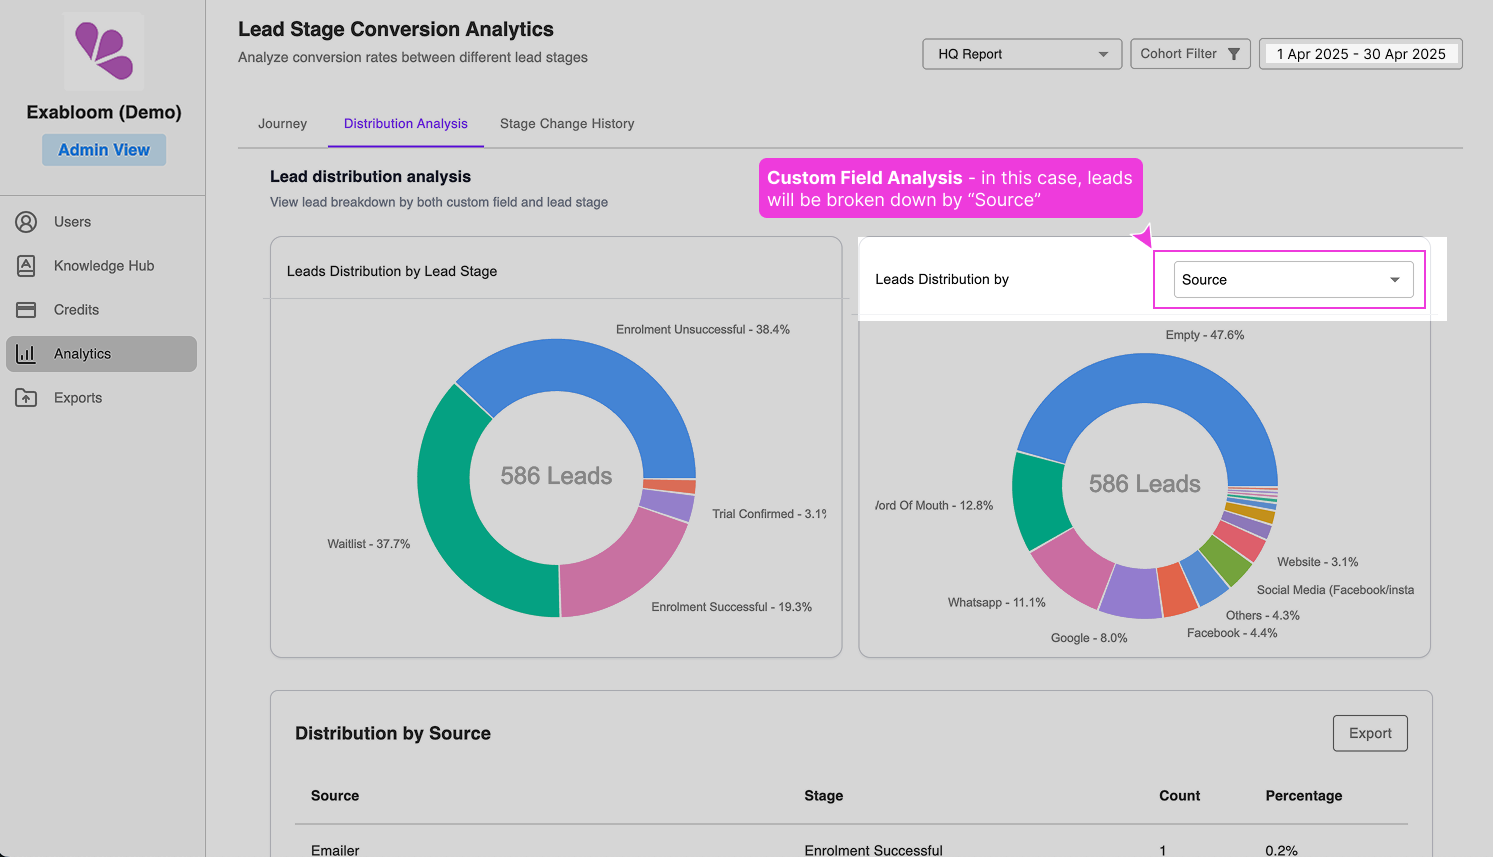
The chart updates to show the field breakdown, and the cross-analysis table at the bottom shows the count of leads for each combination of field value and stage.
What to look for
- Pipeline balance — are leads evenly spread across stages, or are they accumulating in specific stages?
- Source performance — which lead sources generate the most volume? Which produce leads that progress furthest?
- Team workload — how are leads distributed among team members?
Combining with Journey analysis
Use Distribution to identify current priorities (e.g., "200 leads are stuck in qualification"), then use Journey to understand how they got there (e.g., "most came directly from Google Ads, skipping the initial contact stage").