Create a Report
Set up an analytics report that defines the scope and parameters for your analysis.
Steps
-
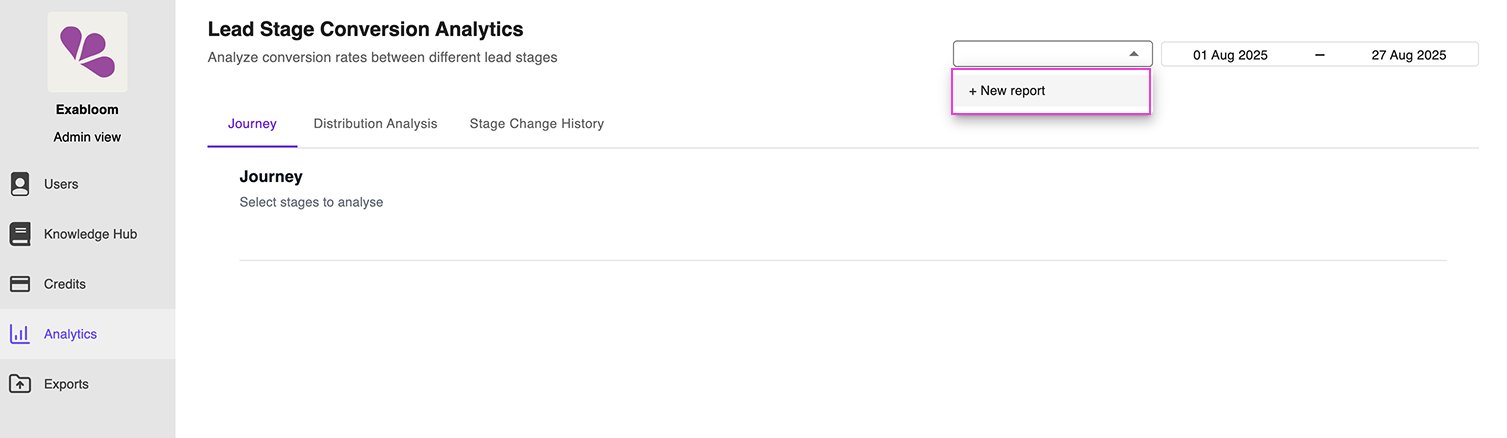
In the analytics dashboard, click the report dropdown (left of the date range picker) and select New Report.
-
Enter a descriptive name (e.g., "Monthly Lead Journey - All Locations").
-
Choose the account scope:
- Single location — analyses leads from one account only
- Multiple locations — aggregates leads across selected accounts
-
Select the lead pipeline to analyse (one pipeline per report).
-
Categorise your pipeline stages into two groups:
Processing — stages where leads are actively being worked on. These must be ordered to match your actual business workflow (e.g., New Lead, Contacted, Qualified, Proposal Sent).
Processed — final destination stages where leads rarely change (e.g., Converted, Lost, Unqualified). Order does not matter.
warningJourney analysis relies on correct Processing stage order. Incorrect ordering will produce misleading conversion paths.
-
Click Finish to create the report.
Your report is now available in the report dropdown for both Journey and Distribution analysis.
Date ranges filter leads by creation date, not when they moved through stages.